
If you teach sixth-grade math, you know the moment is coming: we put ratios in front of a brand-new group of students, and suddenly we can see who is tracking multiplicative thinking and who is still reaching for additive shortcuts. That is why 6.RP.A.3 matters so much. This standard is not just about getting correct answers. It is about helping students see relationships, represent them clearly, and use ratio and rate reasoning to solve real problems they can explain.
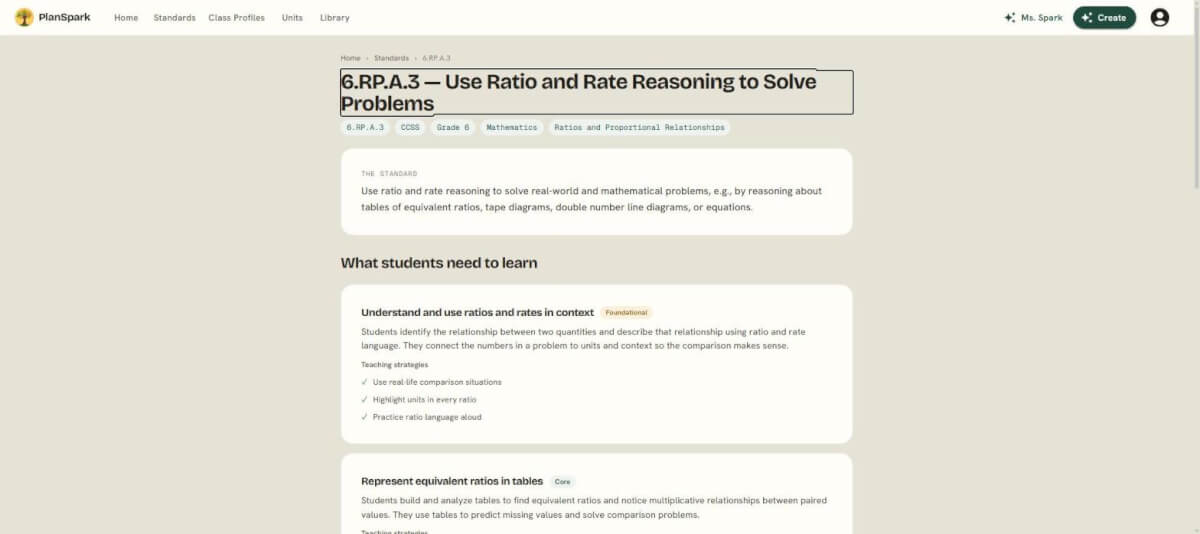
When we unpack 6.RP.A.3, we are really planning a sequence. Our students need repeated chances to move among contexts, tables, tape diagrams, double number lines, unit rates, and percent as a rate per hundred. The good news is that once that sequence is clear, it becomes much easier to build targeted practice, small-group support, and extension tasks. If you want a teacher-friendly breakdown before you plan, PlanSpark’s Standards Unpacker and the free 6.RP.A.3 standard breakdown are both helpful starting points.
What 6.RP.A.3 really asks students to do
The language of 6.RP.A.3 asks students to use ratio and rate reasoning to solve real-world and mathematical problems. In classroom terms, that means students should be able to:
- Make sense of a ratio in context
- Create and extend equivalent ratio tables
- Represent situations with tape diagrams and double number lines
- Use unit rate to find missing values or compare situations
- Interpret percent as a rate per 100
- Explain why their method works, not just what answer they got
For many sixth graders, this is their first sustained work with ratios as relationships between two quantities. That means we need to be very intentional about representation and language. If we rush to procedures, students often fall back on fraction habits that do not fit the situation.
The misconception that eats the most time
If I had to name the misunderstanding that causes the most reteaching in ratio units, it is this: students treat every ratio like a fraction of the whole.
For example, if a class recipe uses 2 cups of juice concentrate for every 5 cups of water, some students see 2/5 and assume 2 out of 5 total parts are concentrate. But that is not what the ratio says. It says 2 parts concentrate to 5 parts water. The total mixture is 7 parts.
This confusion shows up everywhere:
- Students add when they should scale multiplicatively
- Students use the denominator as the whole without checking the context
- Students confuse part-to-part ratios with part-to-whole fractions
- Students misread percent problems because they are not attending to “per 100”
How to surface this misconception early
Do it on day one, before it gets buried.
Try a quick warm-up like this:
A trail mix has 3 cups of pretzels to 2 cups of raisins.
- What does the ratio 3:2 compare?
- How many total cups are in one batch?
- What fraction of the whole batch is raisins?
- What fraction of the whole batch is pretzels?
Then discuss the difference between:
- ratio: 3 cups pretzels to 2 cups raisins
- fraction of the whole: 2/5 of the mix is raisins
That single conversation saves us time later because students begin to hear the language difference between to and out of. I like to keep those two phrases posted all through the unit.
A practical sequence for teaching 6.RP.A.3
In most sixth-grade classrooms, ratios go more smoothly when we move from concrete context to visible representation to abstraction. A sequence like this works well:
- Start with contextual ratios students can picture
- Build equivalent ratio tables
- Represent the same situation with tape diagrams
- Move to double number lines for scaling and comparison
- Use unit rate to solve missing-value and comparison problems
- Introduce percent as a special rate per hundred
The key is not treating these as separate topics. They are connected ways of seeing the same multiplicative relationship.
Representation 1: Equivalent ratio tables
Equivalent ratio tables are often the best entry point because they let students organize repeated scaling in a way that feels concrete. They also expose whether students are adding or multiplying.
Worked example: school fundraiser bracelets
Problem: For every 4 bracelets sold, the student council earns $10. How much money will they earn for 12 bracelets? For 20 bracelets?
Start with a ratio table:
| Bracelets | Dollars |
|---|---|
| 4 | 10 |
| 8 | 20 |
| 12 | 30 |
| 20 | 50 |
Discuss what happened in each row:
- 4 to 8 is multiply by 2, so 10 to 20 is multiply by 2
- 4 to 12 is multiply by 3, so 10 to 30 is multiply by 3
- 4 to 20 is multiply by 5, so 10 to 50 is multiply by 5
This is where we can stress the big idea: equivalent ratios are created by scaling both quantities by the same factor.
What to listen for
If a student says, “I added 4 each time on the left and 10 each time on the right,” that is worth unpacking. In a ratio table, repeated addition can work because it represents repeated groups of the same ratio. We want students to connect that repeated addition back to multiplicative structure.
Instructional tip
Give students incomplete tables and ask, “What could go here, and how do you know?” That explanation piece matters as much as the number.
Representation 2: Tape diagrams
Tape diagrams help students see ratio structure before they compute. They are especially useful for students who need a visual bridge from part-to-part comparisons to total quantities.
Worked example: red and blue paint
Problem: A paint mixture uses red and blue paint in a ratio of 3:5. If one batch uses 24 cups total, how many cups are red and how many are blue?
Draw a tape diagram with 3 equal parts for red and 5 equal parts for blue. Altogether, there are 8 equal parts.
Then reason:
- 24 total cups ÷ 8 total parts = 3 cups per part
- Red: 3 parts × 3 cups = 9 cups
- Blue: 5 parts × 3 cups = 15 cups
This is a beautiful place to revisit the common misconception. If students see 3:5 and think “3 out of 5 total,” the tape diagram corrects that by making all 8 parts visible.
When tape diagrams are especially helpful
- Part-to-part ratios with a known total
- Students who confuse the whole with one quantity in the ratio
- Early percent problems, where 100 can be shown as the total number of equal parts
Representation 3: Double number lines
Double number lines make scaling visible across two quantities. They are especially powerful when students need to track multiplicative jumps, benchmark values, or non-unit scaling.
Worked example: miles and time
Problem: A runner goes 6 miles in 48 minutes at a constant rate. How far does the runner go in 24 minutes? In 72 minutes?
Set up a double number line:
- Distance line: 0, 3, 6, 9
- Time line: 0, 24, 48, 72
Because 24 is half of 48, the distance is half of 6, which is 3 miles. Because 72 is 1.5 times 48, the distance is 1.5 times 6, which is 9 miles.
Double number lines are wonderful for helping students see that we are not just filling in boxes. We are preserving a constant multiplicative relationship.
Teacher move that helps
Ask students to label their jumps: “How did you move from 48 to 24?” and “What must happen on the other line?” This keeps both quantities connected.
Unit rate: where many students finally see the pattern
Once students have worked with tables and double number lines, unit rate often becomes more meaningful. We are not introducing a trick. We are naming the value of one unit in a relationship they already understand.
Worked example: grocery store apples
Problem: 5 pounds of apples cost $8.75. What is the cost per pound? How much would 8 pounds cost?
Find the unit rate:
- $8.75 ÷ 5 = $1.75 per pound
Then scale up:
- 8 pounds × $1.75 = $14.00
Students can also show this on a table or double number line. That flexibility matters. We want them choosing a method that matches the numbers and the context.
A helpful discussion question
Ask, “Why is finding the value for 1 useful?” In sixth grade, students benefit from hearing that unit rate gives us a common benchmark for solving and comparing problems.
Percent as a rate per hundred
Percent can feel like a new topic, but inside 6.RP.A.3, it is another rate situation. Percent simply means “for each 100.” Keeping that language front and center prevents percent from turning into isolated procedure work.
Worked example: survey results
Problem: In a class survey, 18 out of 25 students chose tacos as their favorite lunch. What percent is that?
We want an equivalent ratio with 100 as the second quantity:
- 18/25 = ?/100
- 25 × 4 = 100, so 18 × 4 = 72
So 72% of the class chose tacos.
With a double number line, students can mark 25 and 100 on one line and 18 and 72 on the other. With a ratio table, they can scale by 4. The main idea stays the same: percent is a rate per hundred.
Questions and tasks that reveal understanding
If we only ask students to find a missing number, we can miss shaky reasoning. A stronger set of tasks includes prompts like these:
- Which representation fits this situation best, and why?
- How do you know these two ratios are equivalent?
- What mistake did this student make in the ratio table?
- Is this comparison part-to-part or part-to-whole?
- Can you solve the same problem with a table and a double number line?
These questions bring misconceptions to the surface while students still have time to adjust.
How to plan practice without overwhelming students
One of the easiest ways to overload sixth graders is to mix too many new representations at once. I recommend sequencing practice sets by representation first, then mixing them later.
A simple progression
- One day focused on equivalent ratio tables
- One day connecting tables to tape diagrams
- One day using double number lines for scaling
- One day centered on unit rate
- One day introducing percent as rate per hundred
- Then a mixed review where students choose the representation
Once you have that sequence set, you can create targeted materials much more efficiently. For example, you can generate practice just for tables, just for tape diagrams, or just for percent problems using PlanSpark’s Worksheet Generator. That makes it much easier to differentiate for students who need one more day with a particular model.
Where standards-aligned planning can save us time
Middle school math moves quickly, and ratios tend to connect to everything that follows: rates, proportions, percent, slope, and beyond. Taking time to unpack the standard at the beginning pays off later.
If you are mapping your lessons or building intervention groups, start by reviewing the standard carefully in PlanSpark’s Standards Unpacker, then compare it with the free 6.RP.A.3 standard breakdown. Those tools can help us clarify what belongs in the unit, what can wait, and which representations deserve the most instructional time.
Final thoughts on teaching 6.RP.A.3
The heart of 6.RP.A.3 is visibility. When students can see ratio relationships in tables, tape diagrams, and double number lines, they are much less likely to rely on guesswork or memorize disconnected steps. They begin to understand that ratios describe relationships, unit rates name those relationships per one unit, and percent is simply a special case per hundred.
As we teach this standard, our most important work is not rushing students to the answer. It is helping them notice the structure, name the quantities being compared, and distinguish a ratio from a fraction of the whole. If your next ratio unit is coming up, take a few minutes to unpack 6.RP.A.3, decide your representation sequence, and build practice that matches it. Your students will feel the difference, and honestly, so will you.